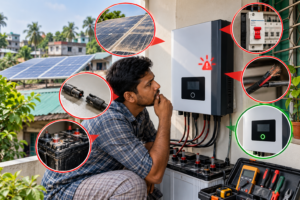
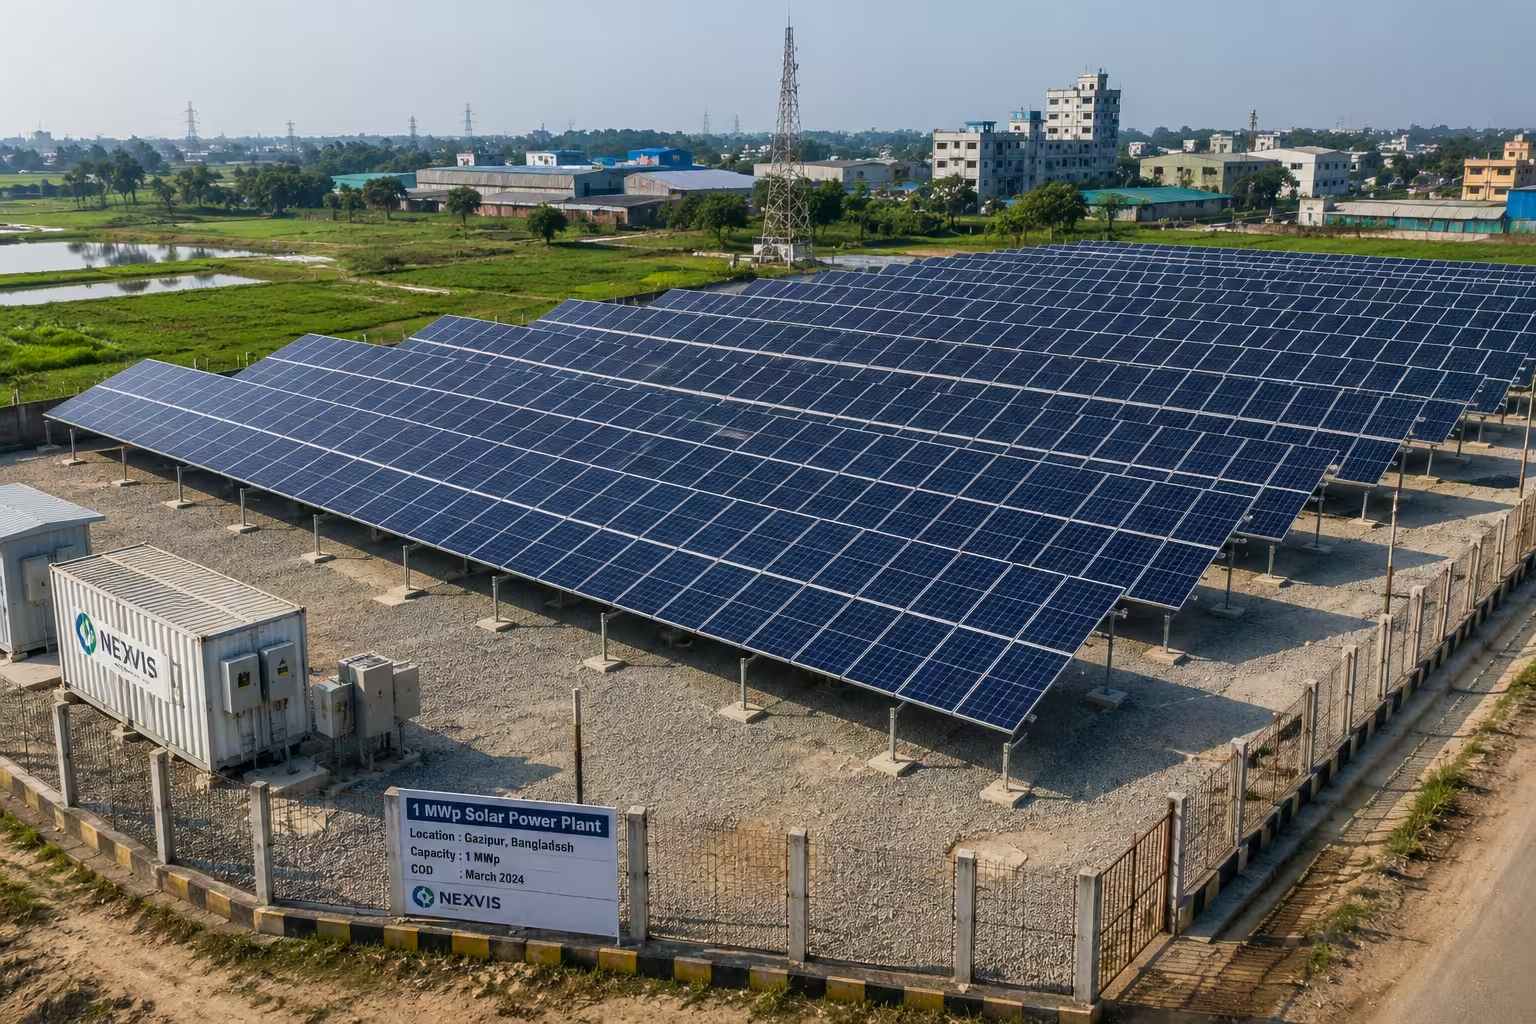
Ask any solar installer in Bangladesh the same question a homeowner in Rajshahi or a factory manager in Gazipur eventually asks: how much electricity will this system actually give me? It sounds like it should have a one-line answer. It doesn’t — not a reliable one, anyway.
Panel datasheets list output under laboratory conditions. Sales brochures round up. Real rooftops have shade from a neighbour’s water tank, warm afternoons that quietly eat into performance, and monsoon months that produce a fraction of what a clear December day delivers. The gap between “what the panel can theoretically produce” and “what your system will actually deliver over a year” is exactly what solar energy yield estimation is meant to close.
This article walks through that gap — from the basic kWh math you can do on a napkin, to the loss factors that matter most, to how professional yield assessments work, and what changes when the site is in Bangladesh rather than a European test lab.
What Is Solar Energy Yield?
Solar energy yield is the amount of electricity a photovoltaic (PV) system produces over a defined period, usually expressed in kilowatt-hours (kWh), megawatt-hours (MWh), or as a normalised figure — kWh per kWp of installed capacity, known as specific yield.
It’s a forward-looking estimate, not a guarantee. A yield estimate tells you what a system is expected to produce, based on the solar resource at a specific location, the way the system is designed, and the losses that reduce output between sunlight hitting the panel and electricity reaching your meter.
How Is Solar Energy Yield Calculated?
There are two useful ways to think about this — a simple version most people can follow, and the more detailed version engineers actually use for design and financing decisions.
The simple estimate: capacity × specific yield
For a quick, back-of-envelope figure, the calculation is:
Estimated annual energy (kWh) ≈ System capacity (kWp) × Specific yield (kWh/kWp/year)
For example, if a 10 kWp rooftop system is assumed to have a specific yield of around 1,400 kWh/kWp/year, the estimated annual output would be roughly 14,000 kWh. That 1,400 figure is purely illustrative here — actual specific yield depends heavily on location, orientation, shading, and system design, and shouldn’t be treated as a fixed number for every Bangladeshi rooftop.
This shortcut is useful for a first impression of feasibility. It is not a design-grade estimate, and it’s not something a lender or serious commercial buyer would rely on.
What the calculation does — and doesn’t — tell you
The simple formula tells you an order of magnitude. It won’t tell you how a shaded corner of the roof behaves differently from the open section, how much output is lost to a hot afternoon in April, or how a cloudy monsoon month compares with a clear one in December. For that, you need to understand the individual factors that shape real-world output — which is where the engineering version of the calculation comes in.
The foundational engineering relationship looks like this:
E = A × r × H × PR
Where:
- A = panel area (m²)
- r = module efficiency (%)
- H = incident solar irradiation on the panel (kWh/m²)
- PR = Performance Ratio (the fraction of theoretical output actually delivered)
This formula is genuinely useful for understanding the relationship between solar resource, module efficiency, and system losses. But it’s a simplified, static picture. Professional yield modelling doesn’t run this equation once for the year — it works through time-series irradiance data, hour by hour or month by month, layering in temperature effects, shading patterns, and individual loss mechanisms that change throughout the day and across seasons.
What Factors Affect Solar PV Energy Yield?
Every one of these can move your actual output away from the “ideal” number on a panel’s datasheet.
- Solar irradiance — the amount of sunlight energy reaching the site, which varies by location, season, and time of day
- Panel orientation and tilt — how directly the array faces the sun affects how much irradiance actually lands on the panel surface
- Temperature — panels lose efficiency as they get hotter, which matters a great deal in a warm climate
- Shading — even partial shade on part of an array can disproportionately reduce output, depending on the system’s electrical configuration
- Soiling — dust, pollen, and grime on the panel surface reduce the light reaching the cells
- Module and electrical losses — mismatch between panels, wiring resistance, and connector losses all take a small bite out of output
- Inverter and clipping losses — inverters aren’t 100% efficient, and oversized arrays relative to inverter capacity can “clip” peak output
- System availability and grid limitations — downtime for maintenance, faults, or grid constraints reduces the energy actually delivered over a year
None of these losses is usually dramatic on its own. Stacked together, they’re the reason a system’s real-world output is meaningfully lower than the sum of its panels’ rated wattage multiplied by peak sun hours.
Understanding Performance Ratio (PR)
Performance Ratio is one of the more useful numbers in solar, mostly because it answers a very practical question in a single figure: how much of the theoretical energy actually reached your meter?
PVsyst — one of the industry’s standard simulation tools — defines PR as the ratio of actual energy delivered against the incident irradiation and the system’s nominal power, after accounting for optical, array, and system-level losses. In plain terms: PR captures everything between “sunlight hitting the panel” and “electricity leaving the system,” including shading, soiling, temperature effects, wiring, mismatch, and inverter losses.
A simple way to visualise where PR loses ground:
Solar resource → orientation and tilt losses → shading → soiling → temperature effects → module/mismatch/wiring losses → inverter losses → grid/AC losses → usable energy delivered
There’s no single “correct” PR that applies to every system. It depends on system design, climate, maintenance quality, and how conservatively or optimistically the loss assumptions were made. Be wary of any quote or article that presents a fixed PR as guaranteed — it’s a modelled estimate, not a physical constant.
A Simple Example of Solar Energy Yield Calculation
To make this concrete, here’s a purely illustrative worked example — the numbers are for demonstration only, not a Bangladesh market prediction.
Suppose a business is evaluating a 100 kWp rooftop system.
- Assume an average daily irradiation figure for the site (this would come from resource data specific to that location, not a national average).
- Apply an assumed Performance Ratio — say, in the range solar engineers commonly use as a starting design assumption, before the site’s actual losses are modelled in detail.
- Multiply capacity by the assumed specific yield to get an estimated annual kWh figure.
- Divide by 12 (adjusted for seasonal variation) to get a rough monthly production profile — recognising that a monsoon-season month will produce noticeably less than a clear-sky month in the dry season.
The output of this exercise is a range, not a single number — and that range should narrow as more site-specific data (actual roof orientation, shading obstructions, local irradiance records) is added.
How Professional Solar Yield Assessments Work
Anyone can run the simple formula. A professional yield assessment goes several steps further, and this is where the difference between a rough estimate and a bankable number actually shows up.
Solar resource data
Instead of a generic sunlight assumption, professional assessments use location-specific irradiance datasets — Global Horizontal Irradiance (GHI), Direct Normal Irradiance (DNI), and Plane-of-Array (POA or GTI) irradiance calculated for the exact tilt and orientation of the array. These typically draw on long-term satellite-derived or ground-measured meteorological records rather than a single “typical” year.
Site and system design
The assessment accounts for the actual roof or land geometry, array orientation, tilt angle, row spacing (for ground-mount or large rooftop arrays), and any physical obstructions that could cause shading.
Loss modelling
Rather than a single blended PR figure, each loss mechanism — shading, soiling, temperature, wiring, mismatch, inverter efficiency, and availability — is modelled individually, because they behave differently across the day and across seasons.
Time-series simulation
Professional tools run the calculation across an entire year (or multiple years) of hourly or sub-hourly data, rather than a single annual average, which captures how monsoon cloud cover, seasonal sun angle changes, and temperature swings affect output month by month.
What Are P50 and P90 in Solar Energy Yield?
Once you move into larger commercial, industrial, or investment-grade projects, you’ll start seeing P50 and P90 figures in feasibility reports.
- P50 is the central, or median, production estimate — the output level the system is expected to meet or exceed in half of the years modelled.
- P90 is a more conservative estimate — the output level expected to be met or exceeded in 90% of the years modelled, based on the uncertainty assumptions used in that specific analysis.
| Metric | What it represents | Typically used for |
| P50 | Central/median expected annual yield | Feasibility studies, general planning |
| P90 | Conservative yield with higher confidence of being met | Project financing, lender risk assessment |
One correction worth making clearly: P90 is not simply “90% of P50.” The gap between the two depends entirely on how much uncertainty is built into the specific analysis — the quality of the resource data, the modelling methodology, and the assumptions about interannual weather variability. Two projects with the same P50 can have quite different P90 figures if their uncertainty assumptions differ. P90 is commonly used in project-finance risk analysis, but exactly how it’s applied depends on the financing structure and the requirements of the specific lender — it isn’t a fixed industry constant.
For most residential and small commercial buyers in Bangladesh, P50/P90 analysis is more relevant to larger financed projects than to a straightforward rooftop installation — but it’s useful to understand if you’re evaluating a larger commercial or industrial system, or looking at a project that involves external financing.
Which Tools Are Used for Solar Yield Estimation?
Different projects need different levels of modelling depth. Here’s a quick comparison of the tools commonly referenced in the industry:
| Tool | Best use |
| PVsyst | Detailed, professional-grade PV simulation for system design and bankability studies |
| PVGIS | Preliminary solar resource and yield estimation, widely used for early feasibility checks |
| Global Solar Atlas | Solar resource screening and high-level PV potential mapping |
| SAM (System Advisor Model) | Detailed technical modelling combined with financial analysis |
| Solargis | High-quality solar resource data and modelling for project development |
The practical question isn’t “which tool is best” — it’s “how much modelling depth does this project actually need.” Early-stage feasibility checks can rely on resource-screening tools. Detailed system design benefits from full simulation software. Projects seeking external financing usually need a professional yield assessment built around bankability-grade methodology. Most homeowners installing a rooftop system don’t need PVsyst-level modelling — that level of detail earns its cost on larger, financed, or commercially critical projects.
Solar Energy Yield Estimation in Bangladesh
This is where a generic “sunlight × panel efficiency” explanation stops being useful, and local conditions start to matter.
Solar resource data
Bangladesh isn’t uniformly sunny. Solar resource datasets — such as those maintained through the Global Solar Atlas, which includes country-specific long-term data for GHI, DNI, diffuse irradiance, GTI, optimum tilt angle, and PV output potential (PVOUT) — show that irradiation varies by location across the country. A yield estimate for a site in Rajshahi shouldn’t automatically be assumed to match one in Khulna or Sylhet; site coordinates genuinely matter, and a resource-data lookup for the specific site is a better starting point than a single national average figure.
Temperature and weather
Standard Test Conditions (STC), the basis for a panel’s rated wattage, assume a 25°C cell temperature. Bangladesh’s warm climate means panels routinely run hotter than that during daylight hours, particularly through the pre-monsoon and summer months. Since PV output falls as cell temperature rises above STC, a panel’s nameplate rating shouldn’t be treated as a realistic continuous output figure for a Bangladeshi rooftop — the temperature loss is a genuine, ongoing factor in the yield estimate, not an edge case.
Monsoon and cloud variability
Annual yield isn’t “average sunshine hours × 365.” Irradiation swings substantially between the clearer, drier months and the cloud-heavy monsoon season. A realistic yield estimate accounts for this month-by-month variation rather than smoothing it into a single annual average — which is also why a proper assessment produces a seasonal production profile, not just one annual figure.
Dust and soiling
Soiling is a practical, everyday factor for rooftop solar in Bangladesh, particularly in dustier urban and industrial areas. Research conducted in Gazipur has looked specifically at dust accumulation and its effect on PV performance in a Bangladeshi context — a useful local reference point, though any specific loss percentage from that kind of study reflects its own methodology and conditions, and shouldn’t be generalised as a fixed soiling loss for every rooftop in the country. What it does confirm is that a cleaning and maintenance routine is a real part of protecting yield here, not an optional extra.
Rooftop shading
This is especially relevant in dense urban settings like Dhaka. Adjacent buildings, water tanks, parapet walls, trees, satellite dishes, and rooftop equipment can all cast partial shade across part of an array at different times of day. Because shading losses don’t scale in a simple linear way — a small shaded area can disproportionately affect output depending on how the array is wired — a proper site assessment maps shading patterns across the day and across seasons, not just at a single point in time. A solar shadow analysis during the site survey stage is where this actually gets addressed.
Net metering and energy savings
For grid-connected systems, the energy your panels generate isn’t automatically the same as the electricity that ends up reducing your bill. There’s a distinction worth understanding: PV generation → usable solar energy → self-consumption → grid export.
Bangladesh’s net metering framework is governed by SREDA, which has published rooftop solar and net-metering guidance, including an updated Net Metering Guideline released in 2025. SREDA also positions rooftop solar as an important distributed-generation route for homes, factories, and industrial buildings. What this means practically is that your generation estimate and your actual bill savings are two different calculations — savings depend on your self-consumption pattern, how much excess energy is exported, the applicable tariff structure, and the specific net-metering rules in effect. A high-yield estimate doesn’t automatically translate into proportionally high savings if your consumption pattern and export terms don’t align well with it.
Residential vs Commercial/Industrial Solar Yield
The underlying physics is the same for a home system and a factory rooftop — but what people actually need from a yield estimate is different.
Residential rooftop:
- Focus is usually on a single annual kWh figure and an approximate bill reduction
- Shading from neighbouring structures is often the dominant local variable
- Roof space and orientation constraints (common in apartment buildings) shape what’s even possible
- A simpler estimate is often sufficient for decision-making, though a proper site survey still matters
Commercial/industrial:
- Yield is usually expressed in MWh with a specific-yield figure (kWh/kWp) for benchmarking
- Load profile and self-consumption pattern matter as much as raw generation
- System availability, maintenance planning, and downtime have direct financial consequences
- Larger or financed projects may require P50/P90 analysis and more rigorous loss modelling for lender or investor requirements
If you’re weighing the two, it’s less about “residential yield estimation” and “industrial yield estimation” as separate disciplines, and more about how much precision the decision in front of you actually requires.
How Accurate Is a Solar Yield Estimate?
Every yield estimate carries uncertainty — the honest answer to “how accurate is this number” is “it depends on how it was produced.” A rough capacity-times-specific-yield calculation is a starting point, useful for an early feasibility check, but it carries much wider uncertainty than a full time-series simulation built on site-specific irradiance data and individually modelled losses.
Accuracy typically improves with:
- Better-quality, location-specific solar resource data
- A proper site survey capturing actual shading obstructions
- Individually modelled loss factors rather than a single blended assumption
- Multiple years of historical weather data rather than a single “typical” year
Even a well-modelled estimate isn’t a guarantee — actual weather varies year to year, which is exactly what P50/P90 analysis is designed to communicate for larger projects.
What Information Is Needed for a Professional Yield Assessment?
If you’re preparing to request a proper site-specific assessment, it helps to have the following ready:
- Site address and, ideally, coordinates
- Roof or land layout, including dimensions and any known obstructions
- Roof orientation and available tilt options
- Photos of the site, particularly anything that could cause shading (neighbouring structures, trees, equipment)
- Recent electricity bills, to understand consumption pattern and tariff structure
- Intended system type — on-grid, hybrid, or off-grid
- Grid connection details, where relevant, for net-metering applications
This is broadly the starting point for a solar site survey and forms the basis for moving from a rough estimate to a design-grade one. Where Muspana carries out site-specific assessments, this is the kind of information a proper survey and system design process would work through — not to replace the engineering, but to make sure the estimate reflects the actual site rather than a generic assumption.
Frequently Asked Questions
What is solar energy yield?
Solar energy yield is the amount of electricity a PV system produces over a given period, typically measured in kWh, MWh, or kWh/kWp (specific yield).
How many kWh does 1 kW of solar produce?
It depends entirely on the site’s solar resource, orientation, shading, and system losses — there’s no single figure that applies everywhere. A rough range can be estimated using local irradiance data and an assumed Performance Ratio, but it should always be treated as an estimate rather than a fixed rule.
What is Performance Ratio (PR) in solar?
PR is the fraction of a system’s theoretical energy output that’s actually delivered after accounting for real-world losses like shading, soiling, temperature, wiring, and inverter efficiency.
Is P90 always 10–15% lower than P50?
No. The gap between P50 and P90 depends on the specific uncertainty assumptions used in that project’s analysis — it varies by resource data quality, methodology, and project type, and shouldn’t be treated as a fixed percentage.
Do I need PVsyst for a home solar system?
Not usually. PVsyst-level simulation is most valuable for larger, financed, or commercially critical projects. A properly conducted site survey and a more straightforward yield calculation is often sufficient for a typical residential rooftop.
Does temperature really affect solar output in Bangladesh?
Yes. Panels are rated at 25°C cell temperature, and Bangladesh’s warm climate means panels frequently operate above that during daylight hours, which reduces output relative to the nameplate rating.
How does net metering affect my actual savings from solar yield?
Your yield estimate tells you how much electricity your system generates — not automatically how much you’ll save. Savings depend on how much of that generation you self-consume versus export to the grid, the applicable tariff structure, and the current net-metering rules under SREDA’s framework.
How much does rooftop shading reduce solar yield?
It varies significantly depending on how much of the array is shaded, when during the day it happens, and how the system is electrically configured — a small shaded area doesn’t always mean a small loss. This is exactly why shading analysis is part of a proper site assessment rather than something estimated by eye.