Search “solar payback period” and you’ll find a lot of confident numbers — 3 years, 5 years, 7 years — mostly written for California or Punjab, where tax credits and cheap components change the math completely. None of that tells a factory owner in Gazipur or a farm operator near Rajshahi what to actually expect.
The honest answer is that payback speed depends on your sector, your load profile, and increasingly, on rules that are specific to Bangladesh. Here’s how to think about it properly.
What “ROI” and “Payback Period” Actually Mean
Payback period is simply how many years it takes for the electricity you stop buying from the grid to add up to what you spent installing the system. ROI (return on investment) looks further out — what the system earns you, in savings, over its full working life, usually 25 years or more.
Two businesses with identical roof space can have very different payback periods if one runs machinery ten hours a day and the other only switches its lights on in the evening. Solar only saves you money on the electricity it actually offsets, so how and when you use power matters as much as how much you use.
Why Payback Varies So Much by Sector
Three things drive the difference between a factory recovering its investment in a few years and a farm taking twice as long:
- Load factor — how consistently you draw power through the day. Round-the-clock or full-shift operations use more of what solar produces in real time.
- Roof or land availability — more usable space generally means a larger system relative to fixed costs, which improves the economics.
- Access to financing or incentives — schools and government-linked facilities often have financing routes that private businesses don’t.
Manufacturing
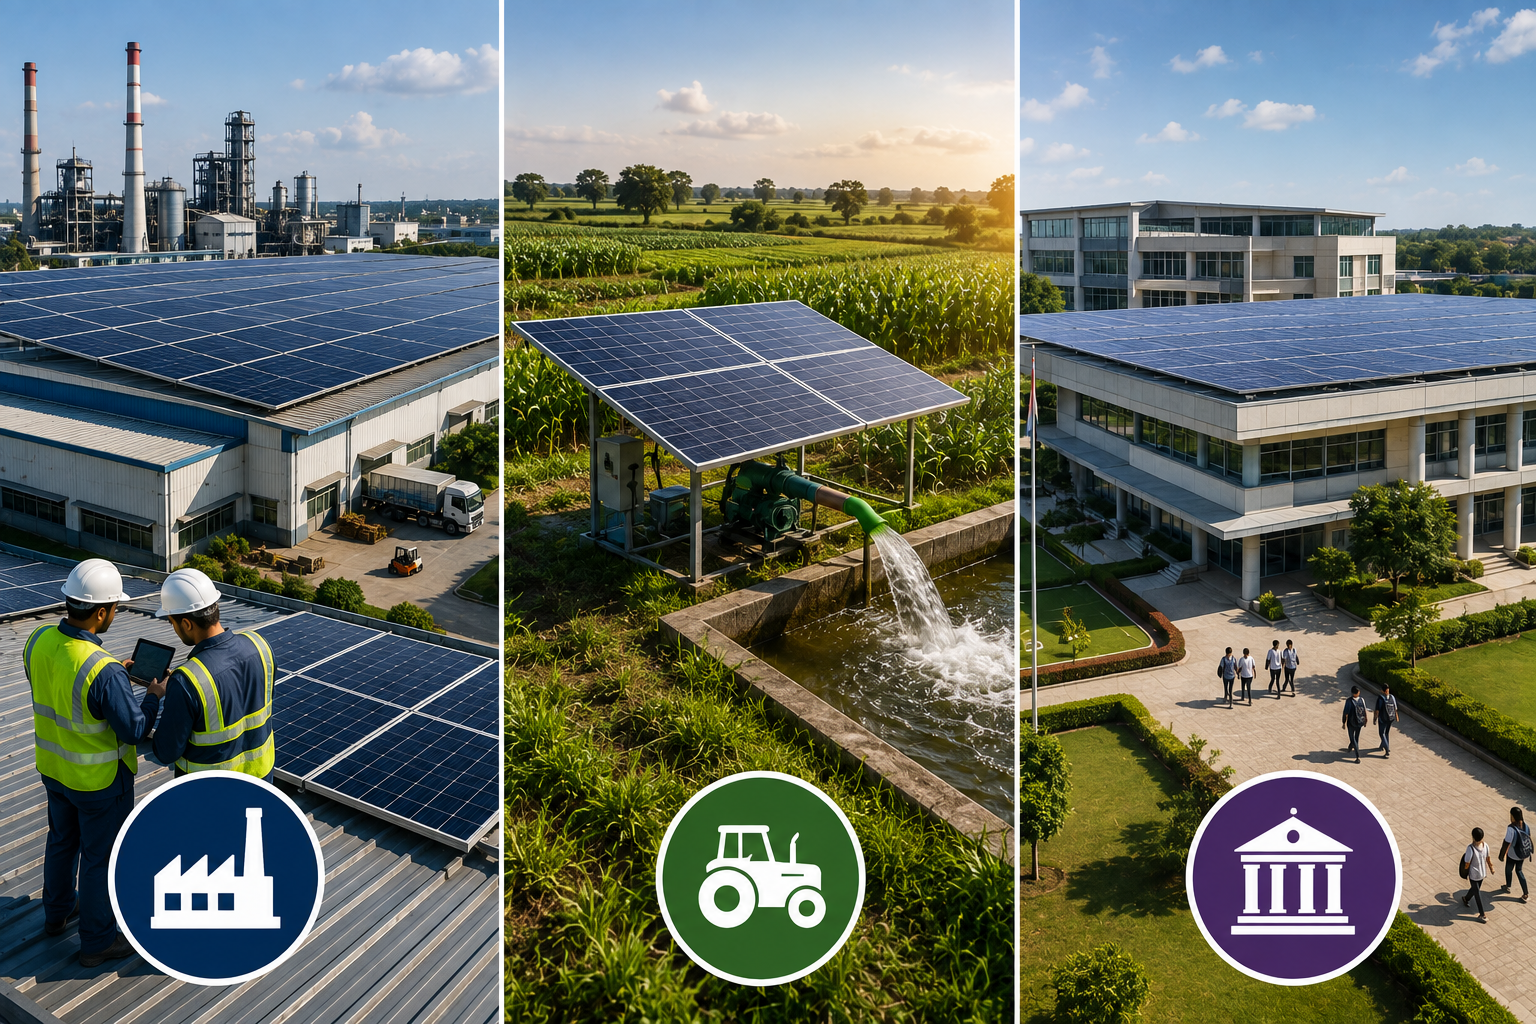
Manufacturing is usually held up as the strongest solar candidate, and for good reason: predictable, high daytime energy use maps closely onto when solar actually generates power. Industrial solar projects generally reach payback within three to five years internationally, with the system continuing to produce electricity for two decades or more. Factories running heavy machinery through daylight hours tend to see the fastest returns, simply because there’s less unused solar output going to waste.
For Bangladesh specifically, this sector matters more than the “manufacturing” label suggests. Bangladesh has more than 7,000 RMG factories with large rooftop areas, and industry estimates suggest fully utilising RMG, textile, and other industrial rooftops could add around 5,000 MW of solar capacity nationally. If you run a garment or textile facility, you’re sitting on exactly the kind of roof and load profile solar is built for.
Agriculture
Farm operations tend to have a longer runway to payback, not because solar performs worse, but because usage is often seasonal and less energy-intensive overall. Agricultural operations often see something closer to a seven-to-eight-year payback within a twenty-year system lifespan, compared to faster-recovering, higher-consumption industries. That’s not necessarily a downside — the long-term asset value of solar tends to suit the generational ownership common in farming businesses, where a longer horizon is already the norm.
Irrigation pumps, cold storage, and drying operations are usually the biggest draws on a farm’s electricity bill, and they’re also the loads most naturally suited to solar, since they often run during daylight anyway.
Schools and Institutions
Institutional buildings sit in an odd middle ground. They can have meaningful electricity use and, in some cases, better access to concessional financing than a private business would. But usage patterns work against them: term-time peaks, empty buildings over holidays, and classroom hours that don’t always match generation hours all reduce how much of the solar output actually gets used on-site. The result tends to be a slower, more variable payback than manufacturing, even where the building and budget look favourable on paper.
The Bangladesh Factor: Why the Numbers Here Look Different
This is where most solar advice falls short for a Bangladeshi reader, because two things specific to this market change the calculation in ways a generic blog post won’t mention.
Import duties skew the cost structure. Panels and inverters carry only around 1% import duty in Bangladesh, but roughly half of the other essential components — mounting structures, cables, and walkways — face tariffs between 62% and 77%. That tax structure alone can make a solar project around 50% more expensive here than the same project in India — a ৳2 crore project in India could cost closer to ৳3 crore in Bangladesh. This is a big part of why payback periods quoted in US or Indian articles rarely translate directly here.
Net metering rules set real constraints. Under Bangladesh’s Net Metering Guidelines 2025, industrial and commercial consumers with a sanctioned load of 10kW or more must install a solar system sized to at least 20% of their approved load. The maximum allowed system size was also raised, from 70% to 100% of your sanctioned load, and single-phase consumers can now join the scheme, which was previously limited to three-phase connections. Surplus electricity you send to the grid is credited over a three-month settlement period ending in March, June, September, and December, and any leftover credit is paid out at a government-set bulk tariff rate.
How you’re billed changes your return. One academic study modelling a large industrial rooftop system in Chattogram found a minimum payback of roughly 4.9 years — but only under an all-energy buy/sell billing arrangement, not standard net metering. Net metering was actually found to be the least profitable of the three billing methods studied, behind net billing and direct energy sale. That’s a narrow, specific finding from one modelled system, not a national average — but it makes an important point: the billing arrangement you choose can matter as much as your sector.
Electricity prices set your baseline. Average business electricity prices in Bangladesh sat around ৳12.39 per kilowatt-hour as of mid-2025, and industrial tariffs have been under upward pressure since, partly tied to the planned removal of energy subsidies. That’s the figure worth anchoring your own estimate to, not a US cents-per-kWh number from a foreign case study.
A Simple Worked Example
This is illustrative only, not a quote for your own project — actual costs vary by system size, roof condition, component choice, and installer.
Say a small factory in Gazipur uses 20,000 kWh a month and currently pays close to ৳12.39/kWh for a large share of that. A rooftop solar system covering a meaningful portion of daytime load could offset a significant chunk of that bill immediately. Whether that translates into a 4-year payback or a 9-year one depends heavily on how much of the system’s output the factory actually consumes on-site versus exports to the grid, and which billing arrangement it falls under.
The only way to get a real number is to model your own load profile against current tariffs — a generic online calculator built for a different country’s incentive structure won’t get you there.
What Actually Speeds Up or Slows Down Your Payback
- How much of your operation runs during daylight hours — the closer your usage matches generation, the faster your return
- Roof or land condition — shading, orientation, and available space all affect system size and output
- Billing method under net metering — net metering, net billing, and direct sale can produce meaningfully different returns for the same system
- Component sourcing — duty-affected balance-of-system parts (mounting, cabling) have an outsized effect on Bangladesh project costs
- Financing route — CAPEX ownership versus an OPEX/PPA arrangement changes who bears the upfront cost and how returns are structured
A solar provider familiar with Bangladesh’s net metering rules and duty-affected component costs can model these variables against your actual load data — a far more useful starting point than a blended, non-Bangladesh payback figure.
Where to Start
If you’re weighing solar for a factory, farm, or institution, the honest first step isn’t picking a payback number off a blog post. It’s getting your load profile, roof or land assessment, and current tariff category modelled together, since those three factors — more than your industry label alone — determine how fast the investment actually pays for itself.
FAQs
Is solar worth it for a factory in Bangladesh?
For factories with consistent daytime power use and enough roof space, solar generally offers one of the faster payback periods among commercial sectors — but the exact timeline depends on your load profile, billing arrangement under net metering, and current tariff rate, not a fixed number.
How does net metering affect solar ROI?
Under Bangladesh’s 2025 net metering guidelines, industrial and commercial users with a 10kW+ sanctioned load must install solar sized to at least 20% of that load, with surplus power credited over three-month settlement periods. The billing method you’re on can meaningfully change your actual return.
Why is solar more expensive in Bangladesh than in India?
Import duty structure is the main reason. Panels and inverters face low duties, but many other required components — mounting structures, cabling — carry tariffs of 62–77%, pushing total project costs meaningfully higher than in neighbouring markets.
Does agriculture get a worse solar ROI than manufacturing?
Not worse — typically slower, because farm energy use is often seasonal and less intensive than continuous manufacturing operations. Given the usual 20+ year lifespan of a solar system, a longer payback still fits well with how most farm businesses plan long-term.
What determines my actual payback period?
Your load profile (how much you use during daylight hours), available roof or land space, the billing method your net metering falls under, and current industrial tariff rates — modelling these together gives a far more accurate answer than any generic industry-wide number.