
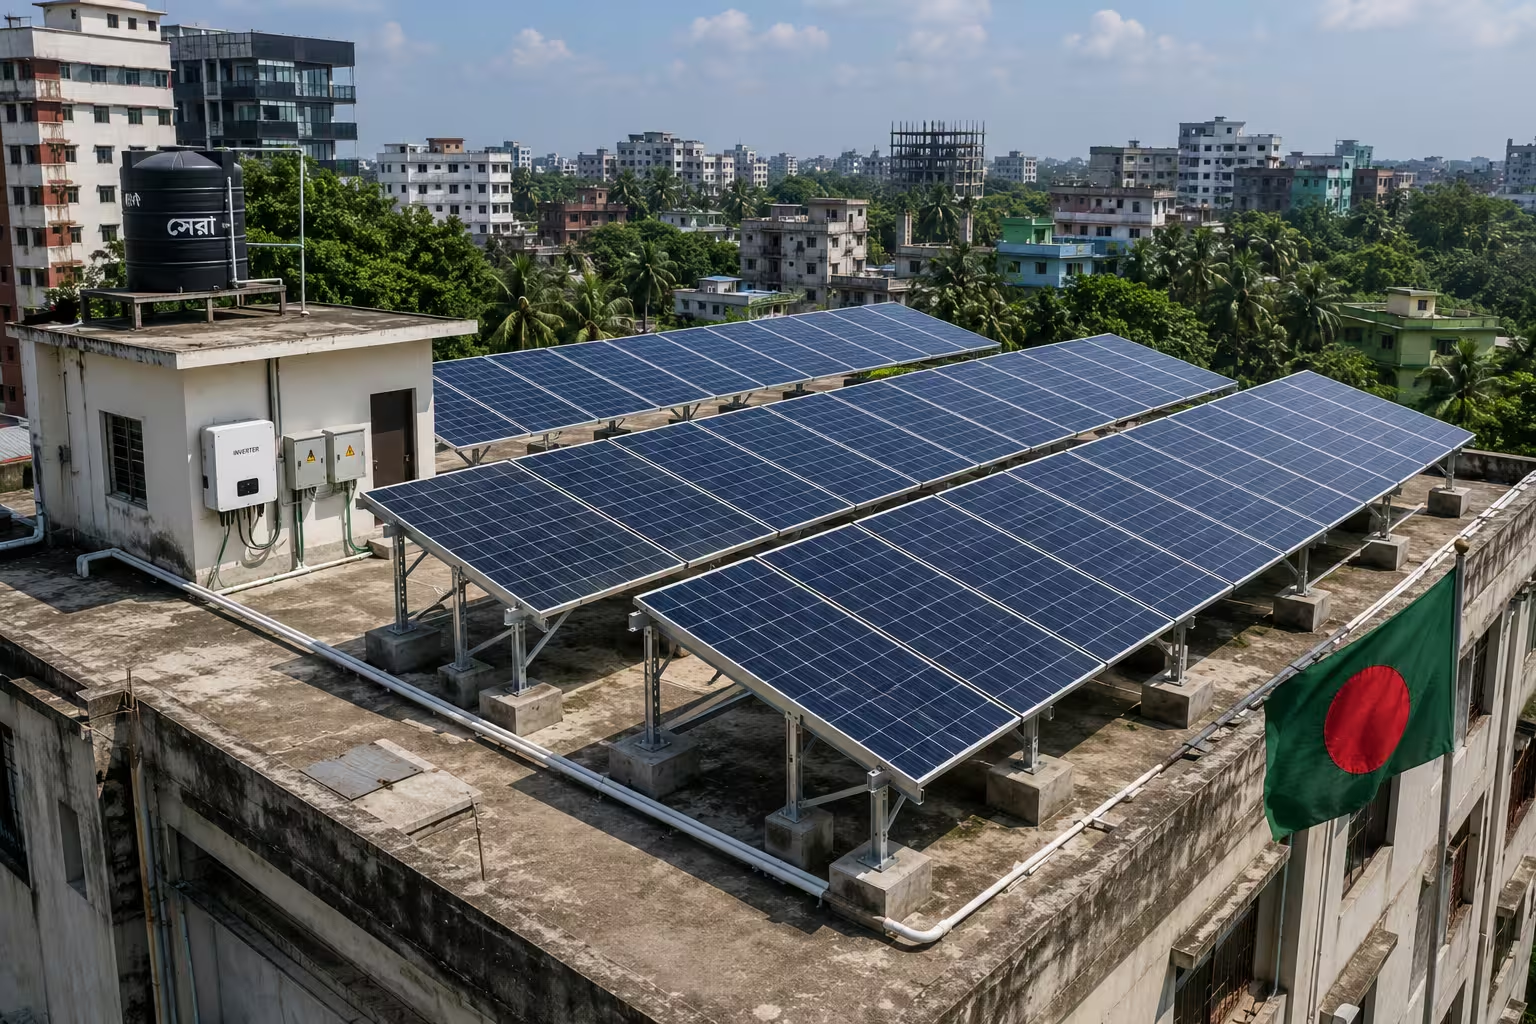
Two identical 1 MW rooftop systems, installed the same month, thirty kilometres apart. One generates noticeably more electricity than the other by the end of the year. Does that automatically mean the lower-output system is worse?
Not necessarily. It might simply have received less sunlight — cloud cover, shading from a neighbouring building, or a few extra humid weeks can all lower the raw kilowatt-hour count without saying anything about how well the system itself was designed or maintained.
This is the exact problem Performance Ratio was built to solve. It strips out the weather and asks a sharper question: given the sunlight this plant actually received, how much of that energy did it actually turn into usable electricity?
For anyone running a factory, warehouse, or commercial rooftop system in Bangladesh — or anyone reviewing an EPC’s generation promise — PR is usually the single most useful number to understand before CUF, specific yield, or anything else on a monitoring dashboard.
What Is Performance Ratio (PR) in Solar?
Performance Ratio is a metric that compares the electricity a solar PV system actually produced against the electricity it theoretically should have produced, based on the sunlight that hit the panels during that period.
It’s defined internationally under IEC 61724, the standard that governs how PV system performance is measured and reported. In IEC terms, PR is the ratio of the system’s final yield (actual AC energy delivered, normalised by system capacity) to its reference yield (the energy the system would have produced if it converted every unit of incoming sunlight at its rated, no-loss efficiency).
Expressed simply:
PR tells you how much of the available sunlight your plant actually managed to convert into usable electricity — after accounting for every real-world loss along the way: heat, dirt, shading, wiring, inverter conversion, and downtime.
PR is always expressed as a percentage, and a real system will always fall below 100%, because no plant escapes every loss.
One thing worth clearing up early: PR is not the same as module efficiency. Module efficiency (usually 18–23% for common crystalline panels) describes how well a single panel converts sunlight into DC electricity under lab conditions. PR describes how well the entire installed system — panels, wiring, inverter, and everything between — performs against its own theoretical potential, in the field, over time.
Why Does Performance Ratio Matter?
For a factory owner or facility manager, PR answers a very practical question: is the generation shortfall this month due to weak sunlight, or is something actually wrong with the plant?
For an engineer or O&M technician, PR is a diagnostic tool. A falling PR trend, tracked month over month, is often the earliest signal of soiling build-up, a failing inverter, or developing shading — long before someone notices it from the electricity bill alone.
For anyone comparing EPC quotes or evaluating a performance guarantee, PR is the number that lets you judge system quality independent of location. A plant in a cloudier district and a plant in a sunnier one can both be well-designed and well-maintained, and both can post a similar PR, even though their raw generation figures look completely different.
How Is Solar Performance Ratio Calculated?
The standard IEC 61724 formula is:
PR (%) = (Actual AC Energy Generated ÷ Reference Yield) × 100
Where:
- Actual AC Energy Generated (kWh) — the real, metered electricity the system delivered over the period, after DC-to-AC conversion.
- Reference Yield (kWh) — the theoretical energy output if the system converted 100% of the sunlight it received at rated (STC) efficiency. It’s calculated as: Plane-of-Array (POA) irradiation received (kWh/m²) ÷ 1 kW/m² (the standard reference irradiance) × the system’s rated DC capacity (kWp).
A couple of terms are worth defining plainly, because they trip people up:
- POA irradiance is the sunlight actually falling on the tilted plane of the panels — not the sunlight falling flat on the ground (that’s GHI, Global Horizontal Irradiance). Using GHI instead of POA in a PR calculation, without adjusting for it, is one of the more common sources of confusing or misleading PR figures.
- STC (Standard Test Conditions) is the lab benchmark — 1,000 W/m² irradiance, 25°C cell temperature — used to rate a panel’s nameplate output.
Solar PR Calculation Example
Here’s a simple, illustrative example — not a real project, just numbers chosen to make the arithmetic clear for a mid-sized Bangladeshi industrial rooftop system.
Imagine a 500 kWp rooftop system on a garment factory in an industrial zone. Over one month, the on-site sensor records 140 kWh/m² of plane-of-array irradiation, and the system’s meter shows 58,000 kWh of AC energy actually delivered.
Step 1 — Reference yield (hours): 140 kWh/m² ÷ 1 kW/m² = 140 hours
Step 2 — Reference energy (kWh): 500 kWp × 140 hours = 70,000 kWh
Step 3 — PR: 58,000 ÷ 70,000 × 100 = 82.9%
That’s a solid result for a fixed-tilt rooftop system. If the same factory’s system had generated only 50,000 kWh against the same irradiation, PR would drop to roughly 71% — a gap worth investigating, even though the sunlight that month was identical.
What Is a Good Performance Ratio for Solar?
There’s no single number that applies everywhere, and any article claiming one universal Bangladesh benchmark is oversimplifying. PR depends on system type, mounting method, technology, climate, and how carefully it’s measured. That said, industry literature and technical references generally converge on rough ranges:
| System Type | Typical First-Year PR Range |
| Residential rooftop | 75–82% |
| Commercial/industrial rooftop | 78–83% |
| Ground-mounted, fixed tilt | 80–85% |
| Ground-mounted with single-axis tracking | 82–87% |
These are general international benchmarks drawn from technical literature and EPC industry practice — not an official Bangladesh standard. A well-maintained system anywhere in the world can sit above these ranges; a poorly maintained one can sit well below them.
Bangladesh-specific research backs up the idea that these ranges are achievable locally. A rooftop solar case study for a university campus in Dhaka reported a simulated PR of around 82%. Separate techno-economic research on utility-scale plants in south-eastern Bangladesh found rooftop systems reaching a PR of 80% or higher, while floating PV on open water bodies performed even better — largely because water cooling keeps panel temperatures lower than on a hot tin or concrete rooftop. A tilt-and-spacing optimisation study for a proposed floating plant on Kaptai Lake modelled a PR above 83% under its best configuration.
But real-world numbers don’t always hit those marks. A published performance study of an operating grid-connected solar plant in Bangladesh, using both software modelling and actual site data, found an annual PR of roughly 71% — noticeably below the ranges above. That gap is the whole point of tracking PR: it tells you when a plant is underperforming its own potential, whatever the weather did that month.
What Causes a Low Solar Performance Ratio?
| Cause | What Happens | What to Check |
| Heat | Panel output drops as cell temperature rises above 25°C | Module temperature, roof ventilation, mounting gap |
| Soiling | Dust, pollen, and bird droppings block sunlight from reaching cells | Cleaning schedule, visual inspection |
| Shading | Nearby structures, water tanks, or trees block part of the array | Shading survey, layout review |
| Inverter losses | Some energy is lost converting DC to AC | Inverter efficiency curve, fault logs |
| Wiring losses | Resistance in cables reduces delivered energy | Cable sizing and length |
| Mismatch | Panels or strings perform unevenly | String-level monitoring |
| Downtime | Generation is unavailable during outages | Availability and fault logs |
| Grid constraints | Energy is generated but not fully exported | Grid/inverter export records |
Bangladesh’s climate touches several of these directly. High ambient temperatures and humidity through most of the year push module operating temperatures above STC conditions for long stretches, which is a normal and expected part of any PR calculation in a tropical climate — not a fault in itself. Dust and pollution in industrial zones like Gazipur or Narayanganj can accelerate soiling losses if a cleaning routine isn’t in place, and monsoon-season cloud cover naturally lowers monthly generation (though usually not PR, since PR already accounts for reduced sunlight).
PR vs CUF: What’s the Difference?
This is where most confusion happens, and it’s worth being precise about it.
- PR asks: “Of the sunlight this plant actually received, how much did it convert into usable electricity?”
- CUF asks: “How much energy did this plant produce, compared with running at its full rated power for every hour of the year?”
| Metric | Performance Ratio (PR) | Capacity Utilisation Factor (CUF) |
| Main purpose | Measures system quality and losses | Measures overall energy productivity |
| Accounts for actual sunlight received? | Yes | No |
| Location/climate dependent? | Only indirectly | Strongly |
| Best used for | Diagnosing design and O&M issues | Estimating annual energy output and revenue |
| Typical formula basis | Actual energy ÷ reference yield (from POA irradiation) | Actual annual energy ÷ (rated capacity × 8,760 hours) |
| Expressed as | Percentage (usually 70–87%) | Percentage (usually 13–22% for fixed-tilt PV) |
Two systems in different districts — one in a sunnier, drier part of the country and one in a cloudier area — can post nearly identical PR values while showing very different CUF values, simply because one location receives more total sunlight over the year. That’s not a flaw in either metric; it’s exactly why the two exist side by side. PR judges the plant. CUF judges the site-plus-plant combination, which matters more for revenue forecasting.
A quick worked comparison, using the same 500 kWp factory system from earlier: over a month with 720 hours, that system generating 58,000 kWh gives a CUF of 16.1% (58,000 ÷ (500 × 720) × 100). Its PR for the same period, calculated earlier, was 82.9%. Both numbers describe the same month of the same plant — they’re just answering different questions.
PR vs CUF vs Specific Yield vs Efficiency
| Metric | What It Measures | When It’s Most Useful |
| Performance Ratio (PR) | System performance relative to available sunlight | Diagnosing losses, comparing quality across locations |
| CUF / Capacity Factor | Output relative to theoretical 24/7 full-power operation | Forecasting annual generation and revenue |
| Specific Yield | Energy produced per kWp installed (kWh/kWp) | Comparing generation output per unit of investment |
| Module/System Efficiency | Sunlight-to-DC electricity conversion at lab conditions | Comparing panel technology, not field performance |
How to Diagnose a Falling PR
If a monitoring dashboard shows PR trending downward over several months, a structured check usually finds the cause faster than guesswork:
- Compare the trend against irradiance data — is the drop matched by unusually poor sunlight, or does PR fall even in good-sunlight months?
- Check sensor calibration — a drifting or misaligned pyranometer can quietly distort every PR reading.
- Review module temperature logs against ambient temperature — an unusually large gap can point to poor ventilation.
- Check the last cleaning date against the soiling trend.
- Pull inverter availability and fault logs for unplanned downtime.
- Compare string-level or panel-level data, if available, to isolate mismatch or a failing component.
- Confirm there’s no new shading source — a water tank, signage, or new construction nearby.
- Check grid export and curtailment records, to rule out energy being generated but not exported.
- Compare the current month against the same month last year, not just the previous month, since seasonal PR swings are normal.
Performance Ratio in Bangladesh
Bangladesh’s tropical climate creates a specific PR picture worth understanding before judging any single number. Average daily solar radiation across most of the country falls in the roughly 4–6.5 kWh/m² range, varying by season and district — peaking around March–April and dipping during the December–January and monsoon months. That seasonal swing means monthly PR will naturally move up and down over the year even on a healthy system; annual PR, calculated over a full 12 months, is the more meaningful number for judging plant quality.
High humidity and heat for most of the year mean temperature losses are a bigger factor here than they would be in a cooler climate — this is expected and already built into any correctly calculated PR, not a sign of a problem. Dust and airborne particulates near industrial zones such as Gazipur, Narayanganj, and parts of Dhaka and Chattogram tend to make soiling losses more noticeable than in cleaner rural sites, which is why a regular cleaning routine matters more for rooftop industrial systems here than the manufacturer’s datasheet alone would suggest.
Grid conditions deserve a specific mention. In parts of Bangladesh, a plant can be generating perfectly normally at the panel level while some of that energy isn’t fully exported, because of local grid constraints, inverter export limits, or net-metering arrangement rules. That’s a distinct issue from a genuinely low PR, and it’s worth separating the two before assuming the system itself is underperforming.
Common PR Mistakes
- Using GHI instead of POA irradiance without adjusting for it, which distorts the reference yield.
- Treating PR as a synonym for “panel efficiency” — they measure different things.
- Comparing PR across different technologies (bifacial vs monofacial, tracker vs fixed) without accounting for the design difference.
- Judging a single month’s PR against an annual benchmark, instead of comparing like periods.
- Ignoring temperature effects when interpreting a summer-vs-winter PR gap.
- Accepting a PR figure without checking sensor quality or calibration behind it.
- Focusing only on the PR percentage and losing sight of actual kWh delivered, which is what ultimately matters financially.
- Treating a design-stage PR estimate as a binding guarantee, rather than a target with a defined tolerance.
Before judging whether a plant’s PR is good, average, or genuinely low, it’s worth reviewing it alongside specific yield, CUF, availability data, and actual site conditions — a single percentage rarely tells the whole story on its own. If you’re reviewing an EPC’s performance guarantee or trying to make sense of your own monitoring dashboard, that kind of side-by-side review is exactly the sort of technical check worth doing before drawing conclusions, and it’s the kind of question Muspana’s engineering team is happy to help walk through for a specific project.
FAQs
What is a good PR for a solar plant?
Most well-designed, well-maintained systems land somewhere between 75% and 87% in their first year, depending on system type — rooftop, ground-mounted, or tracker-based. There’s no single Bangladesh-wide standard number; the right benchmark depends on the specific system design and climate.
What does 80% PR mean?
It means the plant delivered 80% of the electricity it theoretically could have produced from the sunlight it actually received, after accounting for real-world losses like heat, soiling, wiring, and inverter conversion.
How do you calculate PR?
Divide the actual AC energy the system generated by its reference yield (the plane-of-array irradiation received, divided by 1 kW/m², multiplied by the system’s rated capacity), then multiply by 100 to get a percentage.
What is the difference between PR and CUF?
PR measures how well a system converted the sunlight it actually received. CUF measures total output against a theoretical 24-hour, full-capacity benchmark, which makes it far more dependent on location and total annual sunlight.
Does PR change with weather?
Monthly PR can shift with temperature and cloud cover, but it’s designed to stay relatively stable across different sunlight levels, since it already accounts for how much irradiation the system received. Annual PR is a more reliable comparison point than any single month.
What causes low PR?
Common causes include heat, soiling, shading, inverter losses, wiring losses, mismatch between panels or strings, unplanned downtime, and grid export constraints.
Can PR be higher than 100%?
Under standard PR methodology, no — a real system always loses some energy to conversion and environmental factors. A reading above 100% almost always points to a measurement error, such as a miscalibrated irradiance sensor or an incorrect capacity value, rather than genuine performance.
How often should PR be monitored?
Monthly tracking is common for spotting emerging issues early, but annual PR is the more meaningful figure for judging overall system health, since it smooths out seasonal swings.
Is PR more important than CUF?
They answer different questions, so it depends on what you’re trying to assess. PR is more useful for diagnosing whether a specific plant is performing as designed. CUF is more useful for forecasting total annual generation and revenue.
What PR should an industrial rooftop solar plant achieve in Bangladesh?
Published Bangladesh-specific studies on rooftop and floating PV systems have reported PR values from roughly 71% up to the low-to-mid 80s, depending heavily on system design, maintenance, and measurement method. Rather than targeting one fixed number, it’s more useful to track a specific plant’s own PR trend over time and compare it against its design-stage estimate.