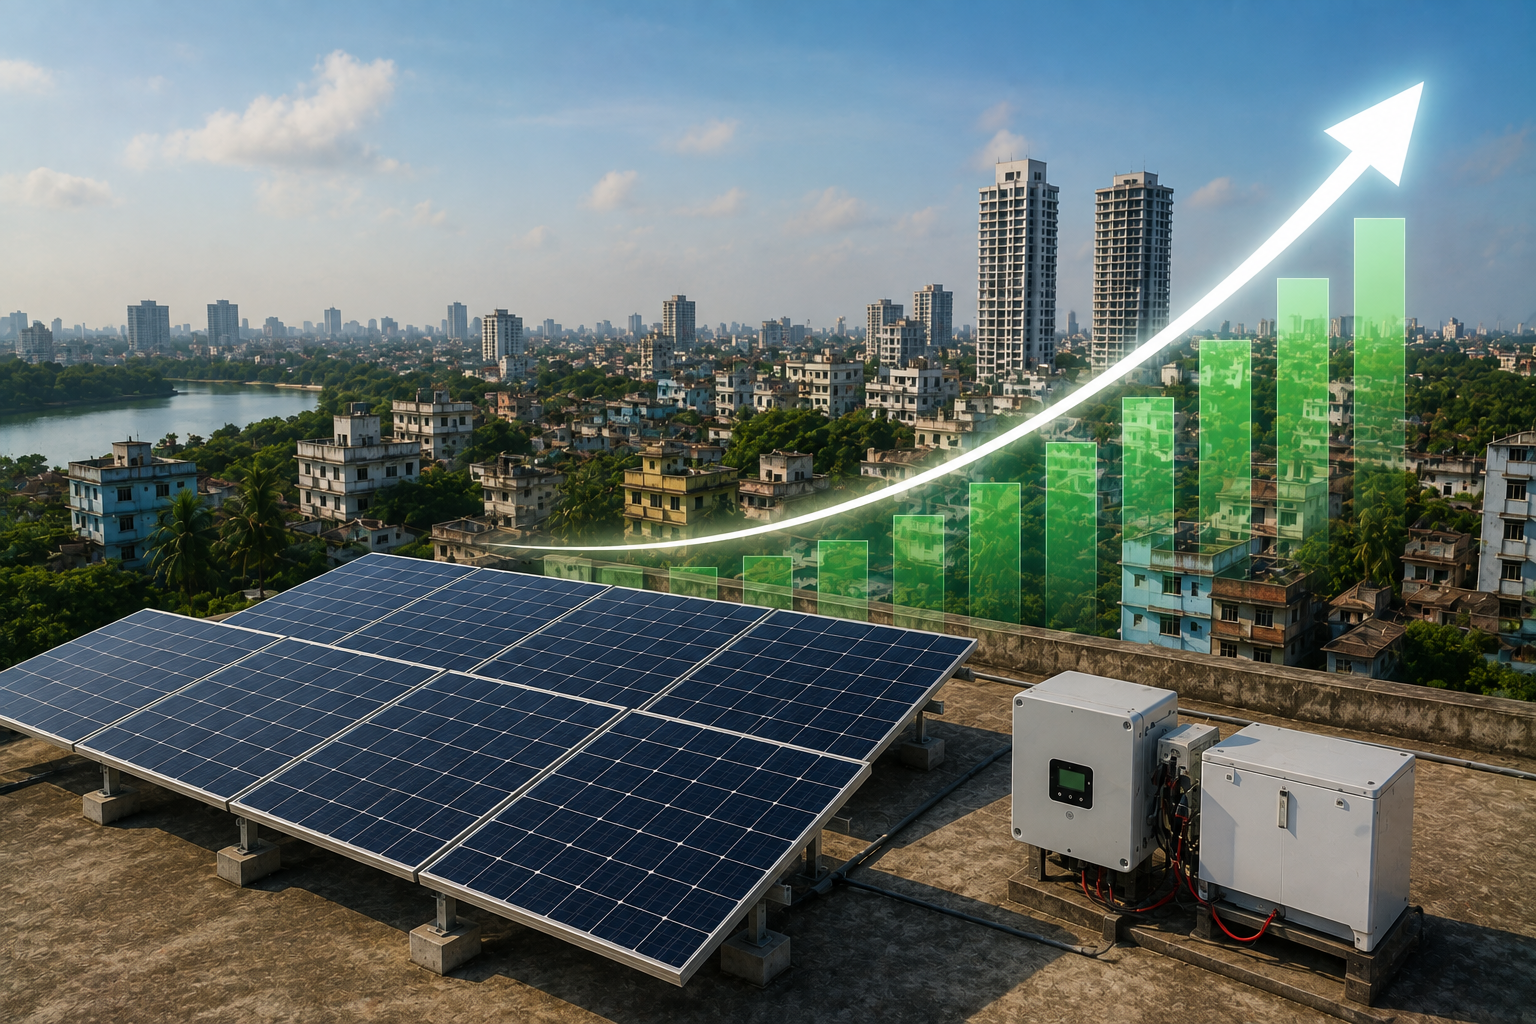
Here’s the headline number first: the global solar market is on track to grow from roughly $217.51 billion in 2025 to $606.18 billion by 2030 — a compound annual growth rate (CAGR) of about 22.5%, according to recent market research. That’s almost a tripling of the industry in five years.
But here’s the twist most summaries skip: at the same time this global growth story is playing out, the residential solar segment in the United States is actually expected to contract by around 21% in 2026. Growth and contraction, happening in the same industry, in the same year. If you’re trying to decide whether now is a good time to buy, install, or invest in solar, that contradiction matters more than the big headline figure.
How Big Is the Solar Market Really Getting?
Globally, installed solar capacity is projected to reach around 914 gigawatts (GW) by 2030, with solar photovoltaic (PV) technology accounting for roughly 80% of all new renewable capacity added worldwide. Asia-Pacific remains the largest regional market by a wide margin, while Europe and North America are also expanding — driven partly by corporate power purchase agreements (PPAs), where large businesses sign long-term contracts to buy solar power directly, and partly by continued policy support in various regions.
It’s worth being precise about what these numbers are: they’re forecasts from current market research, not guaranteed outcomes. Five-year renewable energy projections get revised as policy, financing, and supply chains shift, so treat 2030 figures as a well-informed estimate rather than a locked-in fact.
Where the Growth Is Actually Coming From
Not every part of the solar industry is growing at the same pace. Utility-scale solar — the large power-plant-sized installations that feed electricity directly into national grids — is the strongest-performing segment. In the US market alone, around 211 gigawatts direct current (GWdc) of utility-scale capacity is projected to be added between 2026 and 2031.
Two things are driving that: safe-harbor project pipelines (projects that locked in eligibility for tax incentives before rule changes took effect) and strong long-term contracting activity from utilities and large corporate buyers. In plain terms, big buyers signed deals early, and those projects are now working their way through construction — which gives utility-scale solar a level of momentum that smaller, individually financed residential projects don’t currently have.
The US Residential Exception — And Why It’s Shrinking
This is the part that gets buried in most industry summaries: the US residential solar market is contracting by an estimated 21% in 2026. Two main factors are behind it — a wave of installer bankruptcies, and tighter tax equity constraints (tax equity refers to the financing structures many installers rely on to make solar affordable upfront for homeowners).
When installers go under, projects stall, warranties become harder to enforce, and homeowners lose confidence in signing up for new systems — even if the underlying technology and economics haven’t changed. That’s a market-confidence and financing problem, not a sign that solar technology itself is failing.
The same research forecasts a recovery, with residential solar returning to roughly 6% annual growth from 2027 through 2031, as third-party ownership (TPO) models — where a company owns the solar system and sells the homeowner power at a fixed rate rather than the homeowner buying the system outright — and rising retail electricity rates continue to support demand.
What’s Holding the Industry Back
Even with strong global growth, the solar industry isn’t without friction. The most commonly cited headwinds are:
- Permitting bottlenecks — approval processes for new installations, especially utility-scale ones, can take longer than construction itself.
- Interconnection delays — the wait to physically connect a new solar project to the grid, often the single biggest delay in large projects.
- Policy uncertainty, including rules like the US Foreign Entity of Concern (FEOC) restrictions, which affect which supply chains and manufacturers qualify for certain incentives, and the 2025 expiration of certain federal tax credits, which triggered a short-term rush of installations before the deadline.
None of these are unique to solar — most infrastructure buildouts face permitting and grid-connection delays — but they’re the practical reasons growth isn’t perfectly smooth even in a booming market.
Utility-Scale vs. Residential vs. Commercial: A Quick Comparison
| Segment | 2026 Outlook | Key Driver | Key Headwind |
| Utility-scale | Strongest growth (~211 GWdc added 2026–2031, US) | Safe-harbor pipelines, corporate PPAs | Interconnection delays |
| Residential | Contracting ~21% in 2026, recovering to ~6%/yr from 2027 | TPO models, rising retail rates | Installer bankruptcies, tax equity constraints |
| Commercial | Sustained demand | Rising retail electricity rates, TPO financing | Financing complexity, permitting |
Figures reflect US market research for 2026 and beyond; treat as directional estimates rather than fixed numbers.
What This Actually Means If You’re Buying or Installing
If you’re an installer, EPC contractor, or procurement team, the practical takeaway is this: the growth is real, but it’s concentrated in large, well-financed projects rather than evenly spread across every segment. A business sizing up whether to expand into utility-scale work is looking at a genuinely different market than a company relying mainly on individual residential installations.
For Bangladesh specifically, this US-centric data doesn’t translate directly — Bangladesh’s solar market runs on different levers entirely, including net metering rules, grid reliability, and import-dependent panel supply rather than US tax credit timelines or FEOC restrictions. What does carry over is the broader pattern: global manufacturing and supply trends, heavily concentrated in the Asia-Pacific region, tend to influence panel availability and pricing in import-dependent markets over time. That’s a directional signal worth watching, not a specific number to plan around — if you need Bangladesh-specific figures on system costs or ROI, Muspana’s solar system cost guide and ROI calculator are better starting points than translating US market data.
We track these industry-wide shifts partly because they shape practical advice — for instance, how we think about system financing and sizing recommendations depends on understanding whether supply chains and financing markets are expanding or under strain globally.
The Honest Bottom Line
Solar as an industry is genuinely growing — the global numbers back that up. But “solar is booming” isn’t the whole story in 2026. It’s more accurate to say solar is maturing unevenly: utility-scale is thriving, residential in some markets (notably the US) is going through a financing-driven correction, and the overall trajectory still points firmly upward for the rest of the decade. Understanding which part of that story applies to your situation is more useful than the headline growth percentage on its own.
FAQs
Is the solar industry growing or shrinking in 2026?
Globally, it’s growing strongly — the market is projected to grow at roughly a 22.5% CAGR through 2030. But specific segments vary: US residential solar is contracting in 2026, even as utility-scale solar expands.
Why is the US residential solar market shrinking in 2026?
Mainly due to installer bankruptcies and tighter tax equity financing constraints, not a drop in demand for solar technology itself. A recovery to around 6% annual growth is forecast from 2027 onward.
What’s driving the strongest solar growth right now?
Utility-scale solar, supported by safe-harbor project pipelines and long-term corporate power purchase agreements (PPAs).
Does this US and global market data apply to Bangladesh?
Not directly — Bangladesh’s solar market is shaped by different factors, including net metering policy, grid reliability, and import-dependent panel supply, rather than US tax credit rules. Broader global manufacturing trends can still influence local panel pricing and availability over time.
What are the biggest obstacles to solar growth right now?
Permitting delays, grid interconnection bottlenecks, and policy uncertainty — including US-specific rules like Foreign Entity of Concern (FEOC) restrictions — are the most commonly cited headwinds across the industry.