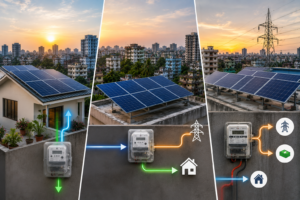

I’ve lost count of how many solar estimates I’ve plugged my own electric bill into over the years, and here’s the annoying part: they rarely agree with each other. One tool says I’d save $54 a month. Another says $89. A third wants my phone number before it’ll tell me anything at all.
If you’re trying to figure out how much you’d actually save with solar, you don’t need another glossy calculator that spits out a number and asks for your email. You need to understand the math behind that number — because once you do, you can check any quote or calculator in about two minutes flat.
That’s what this is. No sales pitch, no “unlock your savings” nonsense. Just the actual formula, a real worked example, and an honest look at where these numbers tend to fall apart.
The Quick Answer, If You’re in a Hurry
Here’s the whole thing in one breath: take your monthly electricity usage in kWh, divide it by 30, then divide that by the average peak sun hours in your area. That gives you the system size in kilowatts (kW) you’d need to cover your usage. Multiply that system size by your local cost-per-watt, then subtract the 30% federal tax credit, and you’ll have a rough total investment — divide your expected annual savings into that number, and you’ve got your payback period.
That’s it. Everything below just walks through each piece with real numbers, because the formula alone doesn’t mean much until you see it in action.
Step 1: Find Out What You’re Actually Using
Before you can size anything, you need your real numbers — not a guess, your actual electricity bill. Pull out a recent one and look for two things:
- Your average monthly bill in dollars (this tells a solar company or calculator roughly how big a system to propose)
- Your monthly usage in kWh (kilowatt-hours — this is the number that actually drives the math, not the dollar amount)
Most utility bills list both, usually somewhere on the second page or in a usage summary graph. If yours doesn’t show kWh clearly, check your utility’s online account portal — almost all of them have a usage history tab now.
A quick note here, because it trips people up constantly: your bill amount and your kWh usage aren’t the same thing, and they shouldn’t be used interchangeably. Two households can both pay $150 a month but use very different amounts of electricity, depending on their utility’s rate structure. Always work from kWh when you can.
Step 2: Size Your System (The Part Most Calculators Get Wrong)
This is where a lot of quick online calculators cut corners, and it’s honestly the part that matters most.
The formula, in plain terms:
System size (kW) = Monthly kWh usage ÷ 30 ÷ average peak sun hours
“Peak sun hours” isn’t the same as daylight hours. It’s a measure of how much strong, usable sunlight your area gets on average per day — and it varies a lot depending on where you live. Arizona might average close to 6.5 peak sun hours a day, while parts of the Pacific Northwest sit closer to 3.5. If you don’t know your region’s number offhand, peak sun hours data by location is easy to look up and worth doing before you trust any estimate.
A real example: a 500 kWh/month household
Let’s say you’re using 500 kWh a month, and you live somewhere with about 5 peak sun hours a day (a reasonably common average across a lot of the U.S.).
- 500 kWh ÷ 30 days = 16.7 kWh per day
- 16.7 kWh ÷ 5 peak sun hours = 3.3 kW system
So you’d be looking at roughly a 3.3 kW to 3.5 kW system, once you round up slightly for real-world losses (inverter efficiency, wiring, a bit of shading — nothing is 100% efficient). That’s a meaningfully different number than just eyeballing “500 kWh, so I need something in the 4-5 range,” which is the kind of vague math a lot of source material and low-effort calculators lean on.
Step 3: Factor In Your Roof and Location
Two houses with identical usage can need very different systems, because the roof itself changes the math.
Things that shift your real numbers up or down:
- Roof direction (azimuth): South-facing roofs generally produce the most in the Northern Hemisphere. East or west-facing roofs still work, just at a discount — usually somewhere in the 15-20% production range compared to due south.
- Pitch: A roof pitch close to your latitude tends to catch the most sun year-round, though this matters less than people expect.
- Shading: Even partial shading from a single large tree can knock production down more than most homeowners assume, especially if it hits the panels during peak midday hours.
- Local climate: Cloud cover, haze, and seasonal weather patterns all affect your real solar radiation exposure, not just your latitude.
None of this means you need to abandon the math from Step 2 — it just means the number you calculated is a starting point, not a guaranteed output. A good installer will adjust for all of this during a site assessment, which is exactly why online estimates and in-person quotes rarely match perfectly.
Step 4: Run the Real Dollar Math
This is where most people actually want to land — what does this cost, and what do you get back?
A quick note on averages: solar installation costs and utility rates vary a lest a lot by state, so treat the numbers below as a working example, not a national promise. A commonly cited national average for installed solar cost sits somewhere around $2.50 to $3.00 per watt before incentives, though this shifts with equipment, labor market, and system size.
How the 30% tax credit changes your payback
The federal solar tax credit — technically the Investment Tax Credit, or ITC — currently lets you deduct 30% of your total system cost from what you owe in federal taxes. This isn’t a rebate check; it’s a credit against your tax liability, so it matters whether you have enough tax liability to use it in a given year (some people carry the remainder forward).
Here’s why this matters so much for your payback math: a lot of online estimates either forget it entirely or bury it in fine print, which makes the payback period look years longer than it actually is.
Putting it together — the same 3.5 kW example:
- System size: 3.5 kW
- Estimated cost before incentives: 3,500 watts × $2.75/watt ≈ $9,625
- After the 30% federal tax credit: $9,625 − $2,887.50 ≈ $6,737.50 net cost
- Estimated annual production: roughly 4,500-5,000 kWh/year for this system size and sun exposure
- If your utility rate is around $0.16/kWh, that’s roughly $720-$800 in annual savings, depending on how much of your production you use directly versus send back to the grid
At that rate, you’re looking at a payback period somewhere in the 8-10 year range — which lines up with typical national averages, generally cited somewhere between 7 and 12 years depending on state incentives, rates, and system cost.
Don’t Skip Net Metering — It Changes Everything
If your utility offers net metering, the excess power your system generates during the day (when you’re probably not home using much) gets credited back to you, often at close to retail rate. Without it, or under a “buyback” policy that pays much less than retail, your effective savings can drop noticeably.
This is one of the biggest variables calculators skip entirely, because net metering policy is set state-by-state (sometimes utility-by-utility), and it’s genuinely one of the first things worth checking before you trust any savings number, including the one you just calculated.
Time-of-use (TOU) rate plans complicate this further. If your utility charges more during peak evening hours and less overnight, your solar savings depend partly on when you’re using power versus when your panels are producing it — which is where a battery, or a good look at your usage pattern, starts to matter.
Where These Estimates Go Wrong
I want to be straightforward about this part, because it’s the section most calculator pages leave out entirely.
- Panel degradation: Most panels lose roughly 0.5% of their output per year. It’s not dramatic, but over 25 years it adds up, and a serious estimate should account for it rather than assuming flat production forever.
- Roof condition: If your roof needs replacing in the next 5-10 years, that’s a real cost that changes your actual payback math — installers will often flag this, but a quick online calculator never will.
- Utility rate changes: This one actually tends to work in your favor. Electricity rates have historically climbed a few percent a year in most regions, so your savings often grow over time rather than staying flat — which most simple calculators don’t model at all.
- Shading you didn’t account for: A tree that’s small now might not be small in ten years.
- Local permitting and interconnection fees: These vary by city and utility, and they’re easy to forget when you’re just running rough numbers.
None of this means solar is a bad calculation to run — it just means treat any single number, including the one from this article’s formula, as a solid starting estimate rather than a guarantee. A real quote from a licensed installer, based on an actual site visit, is the only way to get a number you can fully rely on.
When the Math Doesn’t Work in Your Favor
It’s worth saying plainly: solar doesn’t make financial sense for everyone. If your monthly usage is very low, if your roof is heavily shaded with no good workaround, or if you’re planning to move in the next couple of years, the payback math can stretch out long enough that it’s not worth it. There’s no shame in running the numbers and deciding it’s not the right time — that’s exactly what this calculation is for.
Quick Reference: Bill to Estimated Savings
| Monthly Bill | Approx. Monthly kWh | Estimated System Size | Estimated Annual Savings* |
| $80 | ~500 kWh | 3.0-3.5 kW | $650-$800 |
| $120 | ~750 kWh | 4.5-5.0 kW | $950-$1,150 |
| $160 | ~1,000 kWh | 6.0-6.5 kW | $1,300-$1,550 |
| $220 | ~1,375 kWh | 8.0-9.0 kW | $1,800-$2,100 |
*Based on roughly 5 peak sun hours/day and a $0.16/kWh rate. Your actual numbers will shift with your region’s air mass and solar exposure, local rates, and roof conditions.
FAQs
How many kWh does one solar panel produce per day?
A typical residential panel (around 400-450 watts) produces roughly 1.5-2.5 kWh per day under average conditions, depending heavily on your local peak sun hours and the panel’s orientation. In a higher-sun region, that number climbs; in a cloudier climate, it drops.
Is a bigger solar system always better?
No — oversizing a system past your actual usage usually means paying more upfront for savings you may not fully capture, especially if your utility’s net metering credit is worth less than retail rate. The goal is matching system size to your real usage, not maximizing capacity.
Does shading really matter that much?
Yes, more than most people expect. Even partial shading during midday hours — when the sun is strongest — can meaningfully cut a system’s output, sometimes disproportionately compared to how much of the roof is actually shaded.
How accurate are online solar calculators?
They’re a solid starting point for ballpark numbers, but they can’t account for your specific roof condition, exact shading pattern, or your utility’s current rate structure and net metering policy. Treat them as a first estimate, and confirm anything meaningful with an actual site assessment.
What is a solar payback period?
A solar payback period is the amount of time it takes for your energy bill savings to equal what you paid for the system after incentives. Most residential systems in the U.S. land somewhere between 7 and 12 years, depending on local rates, system cost, and available tax credits.
Does the 30% tax credit apply to everyone?
The federal tax credit applies to most homeowners who purchase (rather than lease) their system, but it’s a credit against tax liability, not a direct rebate — so how much you can use in a given year depends on what you owe. It’s worth checking current eligibility rules or talking to a tax professional before assuming the full amount applies to your situation.
If you want to go deeper on any piece of this — how net metering actually works, what a hybrid solar system changes about the math, or how peak sun hours are calculated for your specific region — those are worth reading before you sit down with an installer. The more of this you understand going in, the less likely you are to walk away with a system that’s sized for someone else’s roof, not yours.